mini-graph-card: Minimalistic Graph Card for Home Assistant Lovelace UI
This repository profile is provided by osrepos.com, an open source repository discovery platform.

Summary
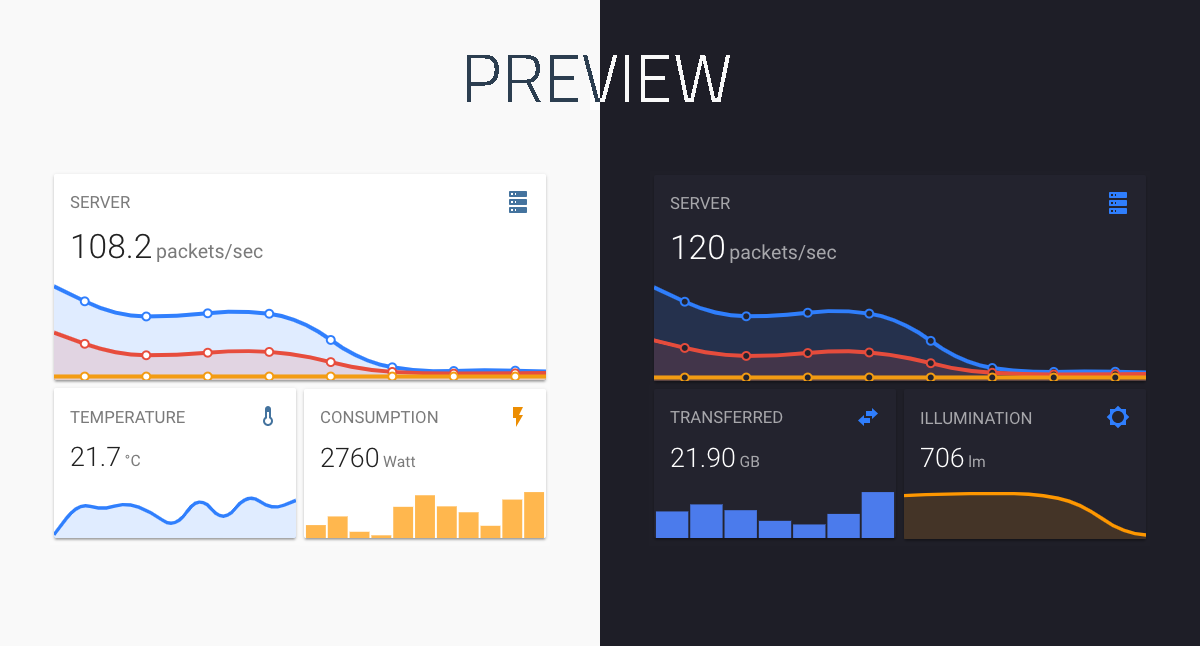
The mini-graph-card is a highly popular and versatile custom Lovelace UI card designed for Home Assistant, offering a minimalistic yet powerful way to visualize sensor data. It provides extensive customization options to display current states and historical data from various entities directly within your smart home dashboard. This project is ideal for users looking to enhance their Home Assistant interface with clear, informative, and aesthetically pleasing data representations.
Repository Information
Topics
Click on any tag to explore related repositories
Use at your own risk
OSRepos shares public repositories for knowledge and discovery only. Any installation, execution, configuration, or use of code from these repositories is the user's own responsibility. Always review the repository, source code, dependencies, licenses, and security implications before running or installing anything. OSRepos is not responsible for issues, damages, or losses resulting from third-party repositories.
Introduction
The mini-graph-card is a highly popular and versatile custom Lovelace UI card designed for Home Assistant. Developed by kalkih, this project offers a minimalistic yet powerful way to visualize sensor data directly within your smart home dashboard. With 3731 stars and 265 forks, it's a testament to its utility and community adoption. Written in JavaScript and distributed under the MIT license, it provides a flexible solution for displaying historical data from various entities.
Its core functionality revolves around presenting the current state of sensors alongside a clean line graph representation of their history. Whether you're tracking temperature, humidity, energy consumption, or binary sensor states, mini-graph-card offers extensive customization options to fit your aesthetic and data visualization needs.
Installation
Getting started with mini-graph-card is straightforward, with several installation methods available:
HACS (Recommended)
The easiest way to install is through the Home Assistant Community Store (HACS). Simply search for 'Mini Graph Card' and follow the prompts.

Manual Install
- Download and copy
mini-graph-card-bundle.jsfrom the latest release into yourconfig/wwwdirectory. - Add the resource reference as described below.
CLI Install
- Move into your
config/wwwdirectory. - Grab
mini-graph-card-bundle.js:
$ wget https://github.com/kalkih/mini-graph-card/releases/download/v0.13.0/mini-graph-card-bundle.js
- Add the resource reference as described below.
Add Resource Reference
If you configure Lovelace via YAML, add a reference to mini-graph-card-bundle.js inside your configuration.yaml:
resources:
  - url: /local/mini-graph-card-bundle.js?v=0.13.0
    type: module
Else, if you prefer the graphical editor, use the menu to add the resource:
- Make sure, advanced mode is enabled in your user profile (click on your user name to get there).
- Navigate to Configuration -> Lovelace Dashboards -> Resources Tab. Hit orange (+) icon.
- Enter URL
/local/mini-graph-card-bundle.jsand select type "JavaScript Module". (Use/hacsfiles/mini-graph-card/mini-graph-card-bundle.jsand select "JavaScript Module" for HACS install). - Restart Home Assistant.
Examples
The mini-graph-card offers a wide array of configuration options to visualize your data. Here are a few examples to get you started:
Single Entity Card
Display a simple graph for a single sensor.
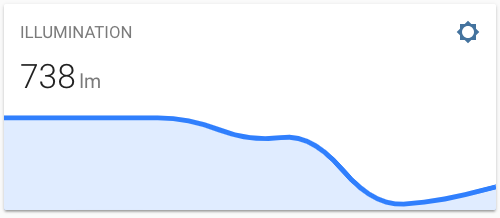
type: custom:mini-graph-card
entities:
 - sensor.illumination
Multiple Entities Card
Combine several related sensors into one graph for a comprehensive overview.
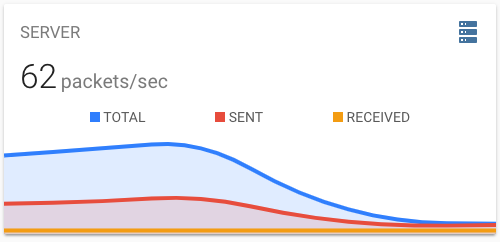
type: custom:mini-graph-card
name: SERVER
icon: mdi:server
entities:
  - entity: sensor.server_total
    name: TOTAL
  - sensor.server_sent
  - sensor.server_received
Bar Chart Card
Visualize data using a bar chart instead of a line graph, useful for aggregated values like daily consumption.
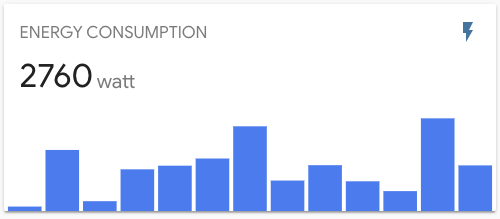
type: custom:mini-graph-card
entities:
  - entity: sensor.energy_consumption
name: ENERGY CONSUMPTION
show:
  graph: bar
Dynamic Line Color
Set thresholds to dynamically change the graph's line color based on sensor values.
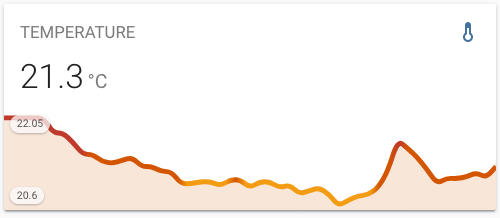
type: custom:mini-graph-card
entities:
  - sensor.sensor_temperature
show:
  labels: true
color_thresholds:
  - value: 20
    color: "#f39c12"
  - value: 21
    color: "#d35400"
  - value: 21.5
    color: "#c0392b"
Non-numeric Sensor States
Graph binary sensors or other non-numeric states by mapping their values to a numerical representation.
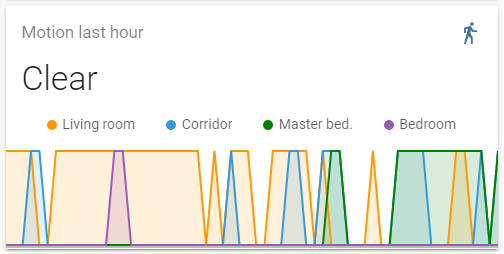
type: custom:mini-graph-card
entities:
  - entity: binary_sensor.living_room_motion
    name: Living room
  - entity: binary_sensor.corridor_motion
    name: Corridor
  - entity: binary_sensor.master_bed_motion
    name: Master bed.
    color: green
  - entity: binary_sensor.bedroom_motion
    name: Bedroom
name: Motion last hour
hours_to_show: 1
points_per_hour: 60
update_interval: 30
aggregate_func: max
line_width: 2
smoothing: false
state_map:
  - value: "off"
    label: Clear
  - value: "on"
    label: Detected
Why Use mini-graph-card?
The mini-graph-card stands out for its exceptional flexibility and aesthetic appeal in Home Assistant dashboards. Its minimalistic design ensures that your UI remains clean and uncluttered, while offering deep customization options to tailor graphs precisely to your needs. From dynamic color thresholds and multiple entity support to advanced data aggregation and handling non-numeric states, it provides powerful visualization capabilities. It's an essential tool for anyone looking to enhance their Home Assistant Lovelace interface with clear, informative, and beautiful data representations.
Links
Explore the mini-graph-card repository on GitHub for more details, advanced configurations, and to contribute to the project:
Related repositories
Similar repositories that may be relevant next.
Loop Engineering: Orchestrating AI Agents with Practical Patterns and Tools
June 25, 2026
Loop Engineering is a GitHub repository offering practical patterns, starters, and CLI tools for building robust AI coding agent systems. It shifts the focus from individual prompt crafting to designing control systems that orchestrate agents over time. This project empowers developers to create autonomous, iterative AI workflows for various development tasks.

Agent-Reach: Empower Your AI Agents with Internet Access, Zero API Fees
June 21, 2026
Agent-Reach is a powerful GitHub repository that equips AI agents with the ability to access and search the entire internet, including platforms like Twitter, Reddit, YouTube, and Bilibili. It provides a streamlined CLI experience, eliminating the need for complex API configurations and associated fees. This project ensures your AI agent can "see" and interact with web content effortlessly.
AI Website Cloner Template: Clone Websites with AI Coding Agents
May 26, 2026
The AI Website Cloner Template is an innovative open-source project that leverages AI coding agents to reverse-engineer any website into a clean, modern Next.js codebase. It enables users to clone entire websites with a single command, extracting design tokens, assets, and reconstructing sections in parallel. This tool is ideal for platform migration, recovering lost source code, or learning web development by deconstructing live sites.
Oh-My-ClaudeCode: Teams-First Multi-Agent Orchestration for Claude Code
May 20, 2026
Oh-My-ClaudeCode is a powerful GitHub repository that provides teams-first multi-agent orchestration for Claude Code, enhancing its capabilities with zero learning curve. It enables developers to build, refactor, and verify code efficiently through intelligent automation and parallel execution. This tool aims to supercharge your Claude Code experience, making complex development tasks simpler and more cost-effective.
Source repository
Open the original repository on GitHub.